
Pro in places
See what your page is doing
Who arrived, where they came from, what they tapped and where they left — and which of those numbers is worth acting on.
Read the overview first
Analytics opens on a row of totals for the window you have chosen. Read them in pairs rather than one at a time.
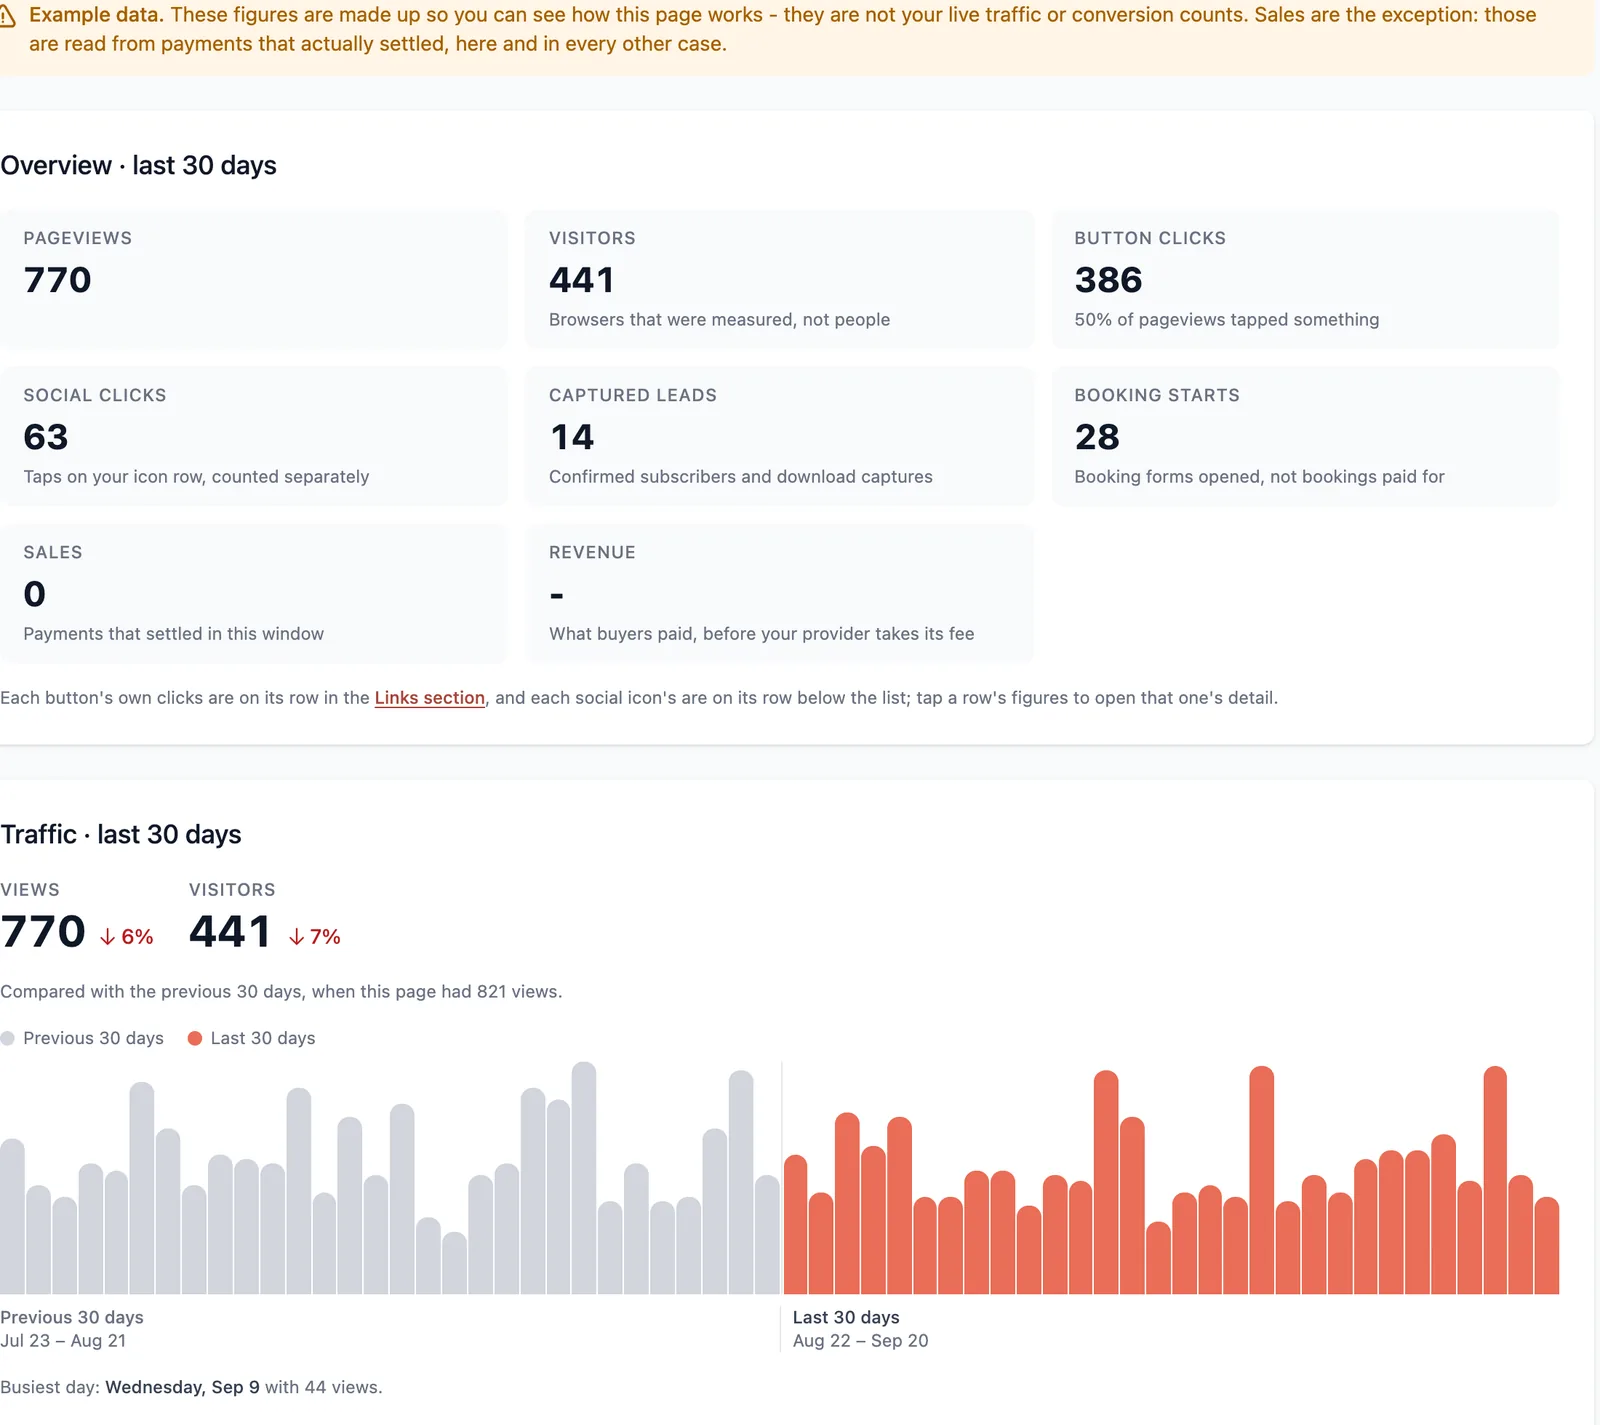
The banner above them is the first thing to understand. Until your page has real traffic these figures are made up, so that you can see what the screen does before you have anything on it — with one exception, called out in the banner: sales are read from payments that actually settled, here and everywhere else. Real numbers replace the examples as they arrive.
Views against visitors tells you whether people are coming back. Visitors against button clicks tells you whether the page is doing anything at all — that second pair is the one worth watching, because a page with traffic and no taps is a page with the wrong things on it, not a page with no audience.
Pick a window you can judge
The range buttons run from a day to three months. The 30-day view opens first because it is long enough to survive one quiet week and short enough to still be about what you are doing now.
Anything shorter than a week shows you your own posting schedule more than it shows you your page. If you changed something on a Tuesday, judge it the following Tuesday rather than on Wednesday morning.
Your own visits to your live page count like anybody else's. The preview inside the studio does not — it never leaves the editor. Checking your page compulsively during a launch will put a small bump in the 24-hour view that washes out over thirty days.
Find the row that is working
Each button's own clicks are on its row in Links, not here. That is the number to use when you are deciding what goes at the top of the page: one figure per row, directly comparable.
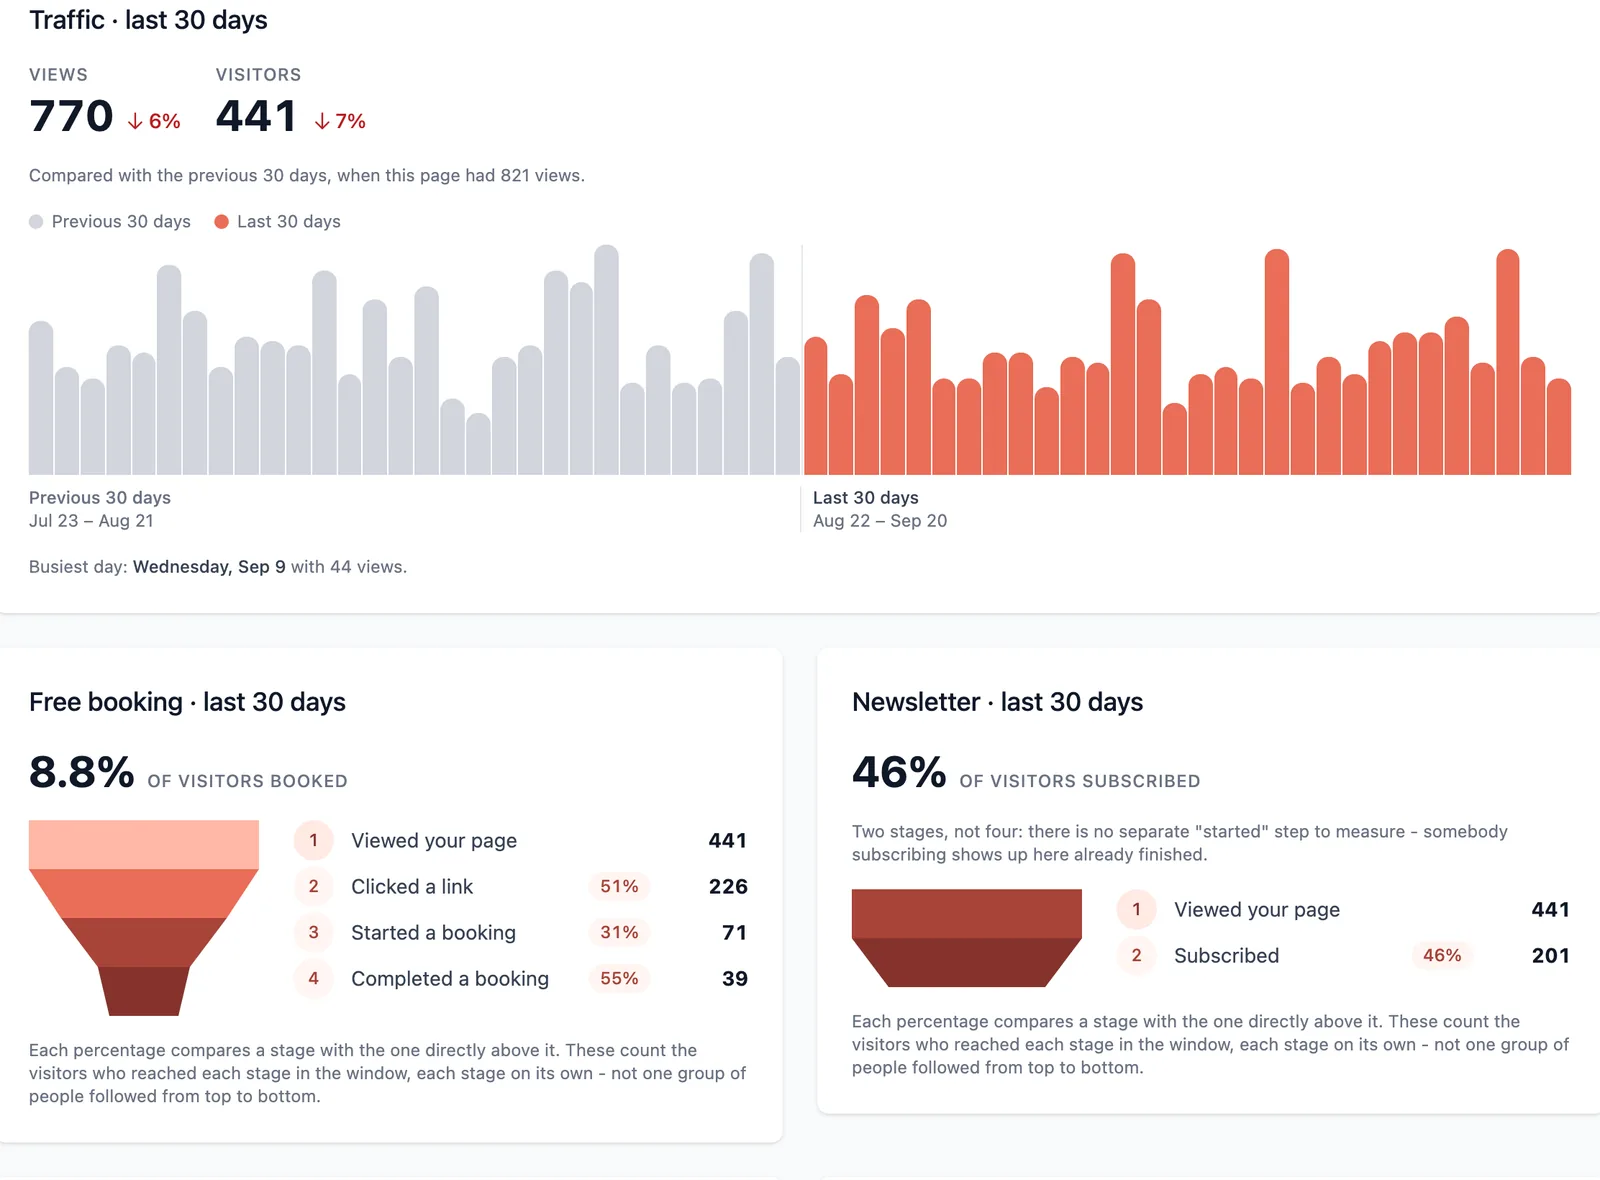
The cards below the overview answer a different question. A funnel follows visitors through a whole goal — arriving, starting, finishing — so when it drops off sharply between two stages, that gap is where to go and look. A row's click count cannot show you the stage that lost people, because the loss happened after the tap.
Traffic and button counts are free on every account.
What the numbers will not tell you
Two blanks are deliberate and neither is a fault. A funnel with too few visitors shows its raw counts and withholds the rate, because a percentage calculated from a handful of people is noise with a decimal point on it. And a country breakdown folds small countries into Other rather than naming them: a single visitor from a small country is close to being an identifiable person, and nothing is dropped by grouping them.
Both resolve themselves as traffic arrives. Neither is something to fix.
Ready to try it?
Your page is free to build, publish and share. The paid corners of this guide are marked where they come up.